⚠️ This article is still in beta — content is being updated as the setup evolves.
Repo: github.com/iqbalhakims/Disaster-Recovery-HA-Demo
What Is DR Testing and Why It Matters
The main objective of DR testing is to make sure the infrastructure is resilient to any possibility of error. The scenarios might be nodes going down, DB connection lost, or pods going down unintentionally. For this part I kill nodes intentionally to make sure the webapp stays up even when going through a disaster. Besides that, we need to make sure users aren't affected by any error from the developer side.
Make sure your team knows you're doing this and keep aligned with the SLO of the company.
I'm keeping the nodes in the same AZ for now because I need to build my production setup first and it's cheaper for testing. Previously when I did DR testing across zones, it took around 40 minutes for pods to move from Zone A to Zone B. When I test in the same zone, it takes less than 10 seconds — probably because it's the same zone and I'm just using a simple Go app. My take is to use Datadog so you can see pods moving from Zone A to B dynamically compared to Grafana, but this one isn't so critical haha.
How the Workload Should Be Distributed
The ideal setup is pods spread across 3 nodes with one node in a different AZ. Zone A is usually the primary zone supporting all workload. The first time I did DR testing by shutting down the subnet in one AZ, the pods weren't spreading to other nodes — production was down. I turned the subnet back on, and after a post-mortem, we realized there was no topology constraint set up to make sure pods move to another node.
Bro, that was my P0 hahahaha.
DR Testing Demo
Canary Deployment with Argo Rollouts
One of the deployment strategies to keep deployments stable is canary deployment, which applies rollout gradually to the cluster. What canary can do is apply 20% of the new deployment and test the feature. Argo Rollouts supports canary deployment by giving us a dashboard to manually continue the deployment after the 20% phase. We can set up alerting in case any error is detected — if something goes wrong, we can rollback to the previous version so all users aren't affected by the bug.
Stress Testing with k6 for 3500 VU
I also ran stress testing with 3500 virtual users just to see pods scaling up with k6. It's a good way to validate that the HPA (Horizontal Pod Autoscaler) is working correctly under real load before trusting it in production.
Details on How I Set Up My Infra
I use DigitalOcean for this setup due to price transparency and it being cheaper for managed Kubernetes. The first thing I did was deploy just one node to make sure everything went well before scaling up.
Deploying Grafana via GitOps
I started by deploying Grafana via GitOps — not using kubectl apply -f grafana.yaml. I use Helm template for a better workflow:
helm template grafana grafana/grafana -f values.yaml > grafana.yamlWhy GitOps? GitOps gives us the flexibility to edit directly in VSCode instead of editing in the terminal, which makes life hard when you're debugging at 2AM. Beyond that, your team can trail who made changes and what changes were made — basically better history and better blame. That said, in SRE culture we have a blameless culture, where a post-mortem is made after an incident rather than pointing fingers.
I made a video on how I deploy Grafana here:
Making Grafana Highly Available
To make sure Grafana is highly available, I use a managed database with Postgres — because PVC doesn't support multi-node setups. When I was using PVC and did DR testing, I couldn't even log in to Grafana. So I migrated from PVC to managed DB with Postgres.
But then another question came up: what happens to the dashboards we built when Grafana comes back up after a DR event? That's where dashboard as code comes in. The traditional way is to set up dashboards manually using PromQL, but the better way is to use a ConfigMap so dashboards are defined as code. You can just kubectl apply -f dashboard-dr.yaml or sync it in ArgoCD. At this point, I think I'm already in love with GitOps lol.
Kustomize for Multi-Environment
I chose Kustomize to handle multi-environment since it's very friendly. What I like about Kustomize is that you can disable a YAML by removing a single line from kustomization.yaml — without deleting the file itself. So you can add resources back whenever you need them.
Domain Management: cert-manager and external-dns
The next step was adding domain management. I use cert-manager and external-dns.
- cert-manager issues the cert for HTTPS and handles cert renewal, since certs typically expire every 3 months.
- external-dns creates records in your registrar such as AWS Route 53 or Cloudflare.
I initially used AWS Route53 but AWS charged me around $0.50/month, so I migrated to Cloudflare which offers free domain management.
Secrets: AWS Secret Manager vs Hashicorp Vault
For secrets, I use AWS Secret Manager. AWS SM charges $0.40 per secret. I researched Hashicorp Vault which offers open-source secret management, but you need to host it on your own server — the cheapest droplet on DigitalOcean is $4/month. After working on this for a while, I estimated my secrets would be under 10, so AWS Secret Manager was the better choice.
Initially I just used Kubernetes Secrets and later migrated to AWS Secret Manager. For the secret operator, I use External Secrets Operator — a tool to fetch secrets from the cluster to AWS Secret Manager.
Container Registry
I use DigitalOcean Container Registry since it has the same ecosystem as DOKS and it's free.
Ingress: Istio
nginx-ingress is actually deprecated, so I use Istio, which supports canary deployment. This is quite critical — canary deploys gradually into the cluster so we can detect anomalies early. The first part of a deployment will only take 20% of the cluster, and we can get alerts if something goes wrong in production. If that happens, it won't affect all users and we can rollback to the previous version.
Handling TLS with Istio
In Istio I route port 80 (HTTP) to port 443 (HTTPS):
apiVersion: networking.istio.io/v1beta1
kind: Gateway
metadata:
  name: istio-ingress-gateway
  namespace: istio-system
spec:
  selector:
    app: istio-ingress
    istio: ingress
  servers:
    - port:
        number: 80
        name: http
        protocol: HTTP
      hosts:
        - grafana.prod.iqbalhakim.ink
        - argo.prod.iqbalhakim.ink
        - rollouts.prod.iqbalhakim.ink
        - prometheus.prod.iqbalhakim.ink
        - litmus.prod.iqbalhakim.ink
        - app.iqbalhakim.ink
        - api.iqbalhakim.ink
        - iqbalhakim.ink
      tls:
        httpsRedirect: true
    - port:
        number: 443
        name: https
        protocol: HTTPS
      hosts:
        - grafana.prod.iqbalhakim.ink
        - argo.prod.iqbalhakim.ink
        - rollouts.prod.iqbalhakim.ink
        - prometheus.prod.iqbalhakim.ink
        - litmus.prod.iqbalhakim.ink
        - app.iqbalhakim.ink
        - api.iqbalhakim.ink
        - iqbalhakim.ink
      tls:
        mode: SIMPLE
        credentialName: iqbalhakim-prod-tls
Then the traffic routes to each service via a VirtualService:
apiVersion: networking.istio.io/v1beta1
kind: VirtualService
metadata:
  name: grafana
  namespace: monitoring
spec:
  hosts:
    - grafana.prod.iqbalhakim.ink
  gateways:
    - istio-system/istio-ingress-gateway
  http:
    - route:
        - destination:
            host: kube-prometheus-stack-grafana.monitoring.svc.cluster.local
            port:
              number: 80
HA Setup: Terraform with HCP
For the HA cluster setup, I use Terraform with HCP to automate cloud provisioning:
resource "digitalocean_kubernetes_cluster" "prod" {
  name    = "prod"
  region  = "sgp1"
  version = "1.35.1-do.2"

  node_pool {
    name       = "prod-pool"
    size       = "s-4vcpu-8gb"
    node_count = 2
  }
}
Since I run a lot of apps, s-4vcpu-8gb is enough to keep CPU usage around 50%.
Pod Spreading: Anti-Affinity and Topology Constraints
For pod spreading I use pod anti-affinity and topology spread constraints:
- Pod anti-affinity ensures pods from the same app don't sit on the same node.
- Topology spread constraints handle pod rescheduling to another available node during disaster recovery.
You need to configure this in every app you deploy to ensure proper spreading across nodes.
Here's a demo of node drain:
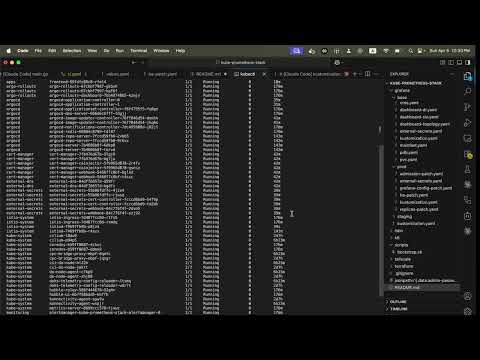
ArgoCD for Config Drift Prevention
I use ArgoCD to make sure all configurations stay aligned with what's set in GitHub. ArgoCD prevents config drifting, which is not good for production — if someone manually patches something in the cluster without updating the repo, ArgoCD catches it and flags the drift.
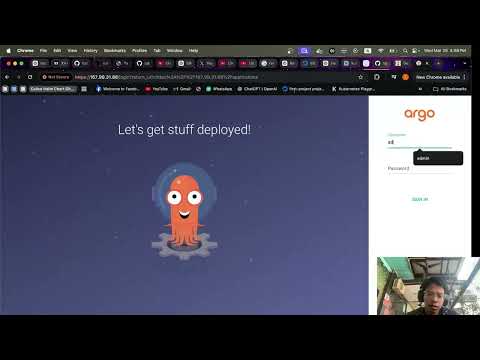
There are two ways to deploy an application in ArgoCD: create it via the UI, or — you can probably guess — the GitOps way. Here's a sample ArgoCD Application manifest:
apiVersion: argoproj.io/v1alpha1
kind: Application
metadata:
  name: grafana
  namespace: argocd
spec:
  project: default
  source:
    repoURL: https://github.com/iqbalhakims/kube-promethues-stack-test
    targetRevision: main
    path: grafana/prod
  destination:
    server: https://kubernetes.default.svc
    namespace: monitoring
  ignoreDifferences:
    - group: ""
      kind: Secret
      name: alertmanager-kube-prometheus-stack-alertmanager
      namespace: monitoring
      jsonPointers:
        - /data
    - group: ""
      kind: Secret
      name: kube-prometheus-stack-grafana
      namespace: monitoring
      jsonPointers:
        - /data
  syncPolicy:
    automated:
      prune: true
      selfHeal: true
    syncOptions:
      - CreateNamespace=true
      - ServerSideApply=true